Description: This is the final project for Duke BIOS-823-2020.

Brief Introduction
An intensive care unit (ICU) provides intensive treatment medicine for patients with severe and life-threatening illness and injuries, or those directly transferred from emergency department. ICUs have higher sta-to-patient ratio then normal wards to provide intensive care and comprehensive monitoring to severe patients, and hence generate a massive amount of electronic healthcare records (EHR) which are useful to predict patients’ disease status and the amount of healthcare needed. The Medical Information Mart for Intensive Care III (MIMIC-III) is a freely-accessible ICU database comprising de-identied EHR of over 60,000 ICU stays for around 40,000 patients who stayed in critical care units of the Beth Israel Deaconess Medical Center between 2001 and 2012. The database consists of rich information about patients’ demographic characteristics, such as gender, age, ethnicity, admission type, and various in-hospital measurements, laboratory tests, procedures and medication of ICU patients over the time. The database provides data from two electronic healthcare record systems, namely the CareVue (from 2001 to 2008) and MetaVision (from 2008 to 2012), which collect and store data dierently.
Objective
The goal is to build a model framework to predict in-hospital mortality. The model would be useful to promptly identify high-risk patients who might be dead within hours or days since ICU admission, so that resources can be eciently allocated during the early stage of ICU st.
Database Description
We referred to the instruction form MIMIC ocial website to set up our database in PostgreSQL. We firstly downloaded the whole dataset from the website. And then we referred the mimiciii schema and build a set of empty tables. After that we import the CSV data les into the empty tables. To interface with Python, we use psycopg2 to connect to database.
Feature Extraction
In this project, to predict the mortality in the early stage of ICU stay, we are using three severityscores: SAPS II, APACHE II, and SOFA scores. For APACHE II, it is calculated from a patient’s age and 12 routine physiological measurements. And measurements are measured during the rst 24 hours after admission, and utilized in addition to information about previous health status (recent surgery, history of severe organ insuciency, immunocompromised state) and baseline demographics such as age. Another key thing is that APACHE II only consider the most deranged physiology value physiology, which means we need to extract the minimum and maximum value with 24 hours.
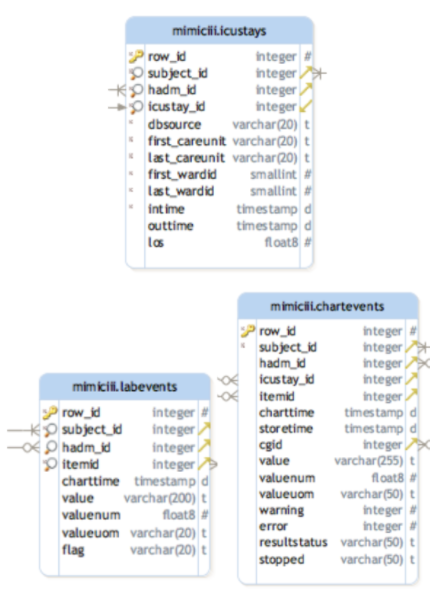
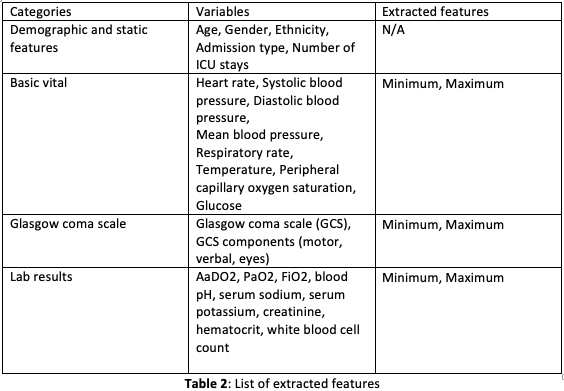
In order to extract the target variables, we rst need a deep understanding on the data schema. According our observation, we found out that the main ICU admission data are included in table \icustays”. And the variable required to calculated these 3 score are distributed in \labevents” table and \chartevents” table. And these two tables connect to \icustay” through a key called subjectID. Table 2 provides the list of extracted features used in the study.
Prediction Modeling
The ultimate goal is to build a model framework to predict in-hospital mortality. For the rst try, a binary classier was trained using the extracted features listed in Table 2 to predict in-hospital mortality. 49,632 ICU stays of our study population were split into 80 percent of training set and 20 percent of test set. Random forest classiers were trained on the training set to predict the in-hospital mortality label (around 12 percent were dead) using 24-hour ICU stay data. Hyperpa- rameter tuning was performed using grid search on 5-fold cross-validation (CV) of the training set. The model performance of the best classier resulted from the grid search were then compared and evaluated on the test set.
Secondly, we trained a Logistic Regression Model with the same test-train split, hyperparameter tuning and CV techniques. Experimental results in the later sections show that both of machine learning models provide us a base to identify high-risk patients who might be dead within 24-hour since ICU admission in the early stage of ICU stay.
Finally, we used neural network. A simple, basic, fully connected neural network with four layers, and four neurons per layer is implemented using Keras. After this initial success, the network should be tuned to increase its performance in order to make better predictions. Predictive power is determined by several factors, mostly network parameter tuning. Tuning is performed in an iterative manner, by trying out several congurations until we nd an optimal one that maximizes accuracy. The following parameters were tuned:
- Number of hidden layers
- Epoch
- Batch Size
- Optimization algorithm
Three main tuning strategies can be used to accomplish this task. The most time consuming, Grid Search, involves trying out all possible combinations of parameters. This is often unfeasible in complex scenarios, as the combinations may easily exceed 10k, which given a training time of about 5 mins would mean that we need to wait for months to nd the optimal parameter conguration. An alternative to Grid Search is Random Search, which tests a predened number of random congurations, maybe 50 or 100, and picks the best one.
After 50 iterations, the optimal parameters are gifted to us: 6 hidden layers, 8 neurons per layer, a batch size of 50, epoch of 25 and Adam algorithm as optimization function.
Evaluation
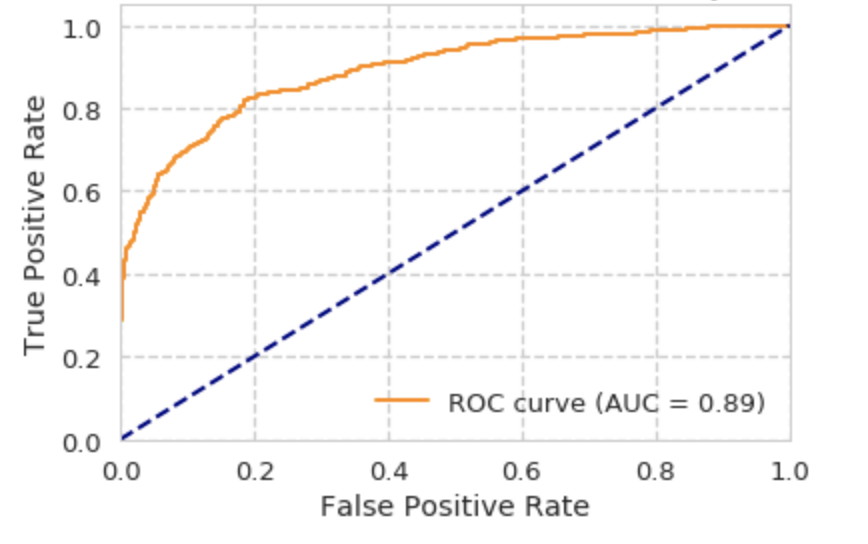
The dataset was split into 80 percent of training set and 20 percent of test set. Hyperparameter tuning was done on 5-fold CV of the training set and the nal evaluation of model performance was done on the test set. Multiple machine learning models in this project were evaluated and compared using the Area under the Receiver Operating Characteristic curve (AUROC) on the test set. The ROC curve is the true positive rate against the false positive rate at various threshold settings. AUROC provides a single measure of the diagnostic ability of a binary classier as its discrimination threshold is varied. We have used AUROC to compare the model performance of the binary classiers.
Experimental Results
ROC curve for Logistic Regression Model:
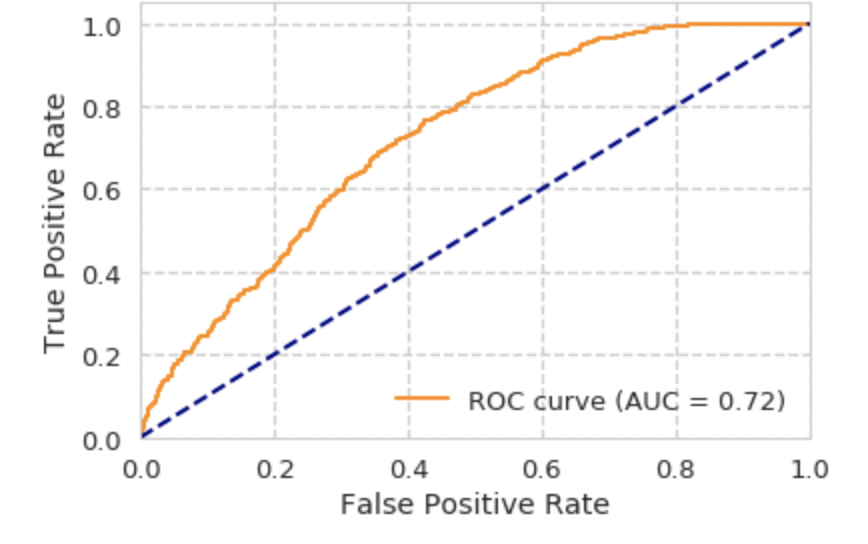
ROC curve for Random Forest:
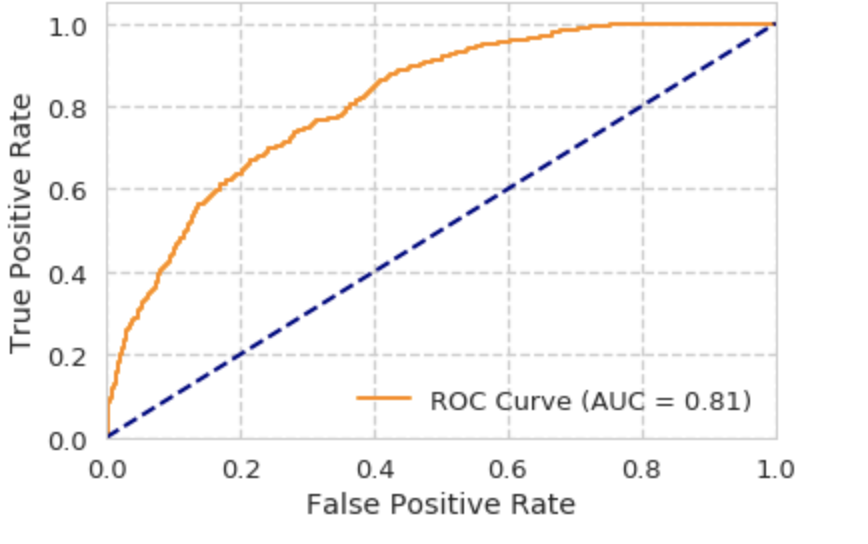
ROC curve for Neural Network:
Discussion
Even though the main objective has been achieved, some improvements could be made to boost the model’s performance and achieve better prediction capabilities. For example, more features could be added, and Long Short-Term Memory Network (LSTM) might can be deployed to handle time series data instead of using aggregation of features.
In addition, results obtained are great, but we are not sure it is conclusive enough to be used in medical practice Even though the mathematical reasoning behind many algorithms used in AI tools is clear, its complexity has made it dicult to comprehend it under the hood. If we are willing to put our lives in the hands of AI, we must make sure we fully understand how this tool works, as well as creating a well thought out legal regulation around its use.